6 Wrap-up and further resources
Let’s look back at what we were aiming to do today:
In this tutorial, we will introduce the audience to ggplot2 and the rest of the tidyverse R packages with the aim of developing sufficient basic skills to visualize multivariate sensory and consumer data. We will provide a learning dataset for the analysis—a set of free response comments and overall liking scores from a central location test on berries. We will teach participants how to import, manipulate, and plot data using user-friendly, “tidy” R programming. All resources used in the tutorial are open-source and will remain available to attendees, including an R script covering the full workflow.
At the end of the tutorial, attendees will be able to prepare raw sensory data for common multivariate visual representations in R.
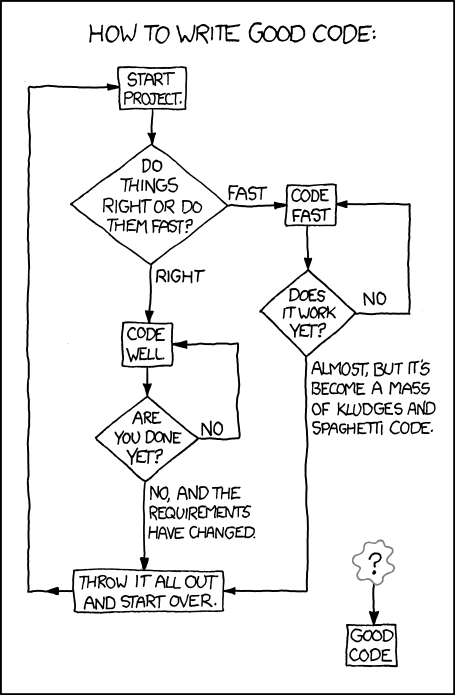
We have managed to touch on all of these topics, but of course we have taken the most cursory look at each. I hope what we’ve gone over today has inspired you, sure, but I mostly hope it has shown you how much you can do with just a little knowledge. My journey in terms of learning data science with R has been all about building my coding ability incrementally. My code looks more like this than anything else, but I am able to get so much done:
By developing your ability to code (in R or Python, or whatever works for you–Julia?) you will open up a whole set of analyses that you would otherwise be unable to access.
6.1 Getting help
- Look up the help file for whatever you’re doing. Do this by using the syntax
?<search item>(for example?cgets help on the vector command) as a shortcut on the console. - Search the help files for a term you think is related. Can’t remember the command for making a sequence of integers? Go to the “Help” pane in RStudio and search in the search box for “sequence”. See if some of the top results get you what you need.
- The internet. Seriously. I am not kidding even a little bit. R has one of the most active and (surprisingly) helpful user communities I’ve ever encountered. Try going to google and searching for “How do I make a sequence of numbers in R?” You will find quite a bit of useful help. I find the following sites particularly helpful
- Stack Overflow
- Cross Validated/Stack Exchange
- Seriously, Google will get you most of the way to helpful answers for many basic R questions.
I want to emphasize that looking up help is normal. I do it all the time. Learning to ask questions in helpful ways, how to quickly parse the information you find, and how to slightly alter the answers to suit your particular situation are key skills.
6.2 Further reading/resources
- General
Rprogramming- Data Carpentry’s R for Social Scientists (and, really the courses from The Carpentries in general)
- Wickham & Grolemund’s R for Data Science
- The stat545 course website
- My own (somewhat opinionated and eccentric) course from VT: FST 5984
- Data Visualization Best Practices
- Healy’s Data Visualization
- “Caveats” from the website Data to Viz, including topics such as why radar plots & pie charts are controversial and what to use instead.
ggplot2-specific- Winston Chang’s R Graphics Cookbook, basically a collection of short tips and sample plots
- R Graph Gallery’s posts breaking down the code to make real, complex, polished ggplots
- ggplot2’s registered extension gallery
We will also be presenting…
6.3 Questions/Comments
If you get stuck, feel free to find us during the conference, or email us at jlahne at vt dot edu and lhamilton at vsu dot edu. I’d love to learn about what you’re working on!